

Broker Globale Piattaforma di Verifica Regolamentare
WikiFX
Italiano
简体中文
繁體中文
English
Pусский
日本語
ภาษาไทย
Tiếng Việt
Bahasa Indonesia
Español
हिन्दी
Filippiiniläinen
Français
Deutsch
Português
Türkçe
한국어
العربية
اردو

FPG AUDUSD Market Report April 3, 2026
Sommario:On the H1 timeframe chart, AUDUSD exhibited a strong bullish rally toward the end of last month, advancing from 0.6832 to a peak at 0.6963. Following this high, a clear price rejection emerged, trigge
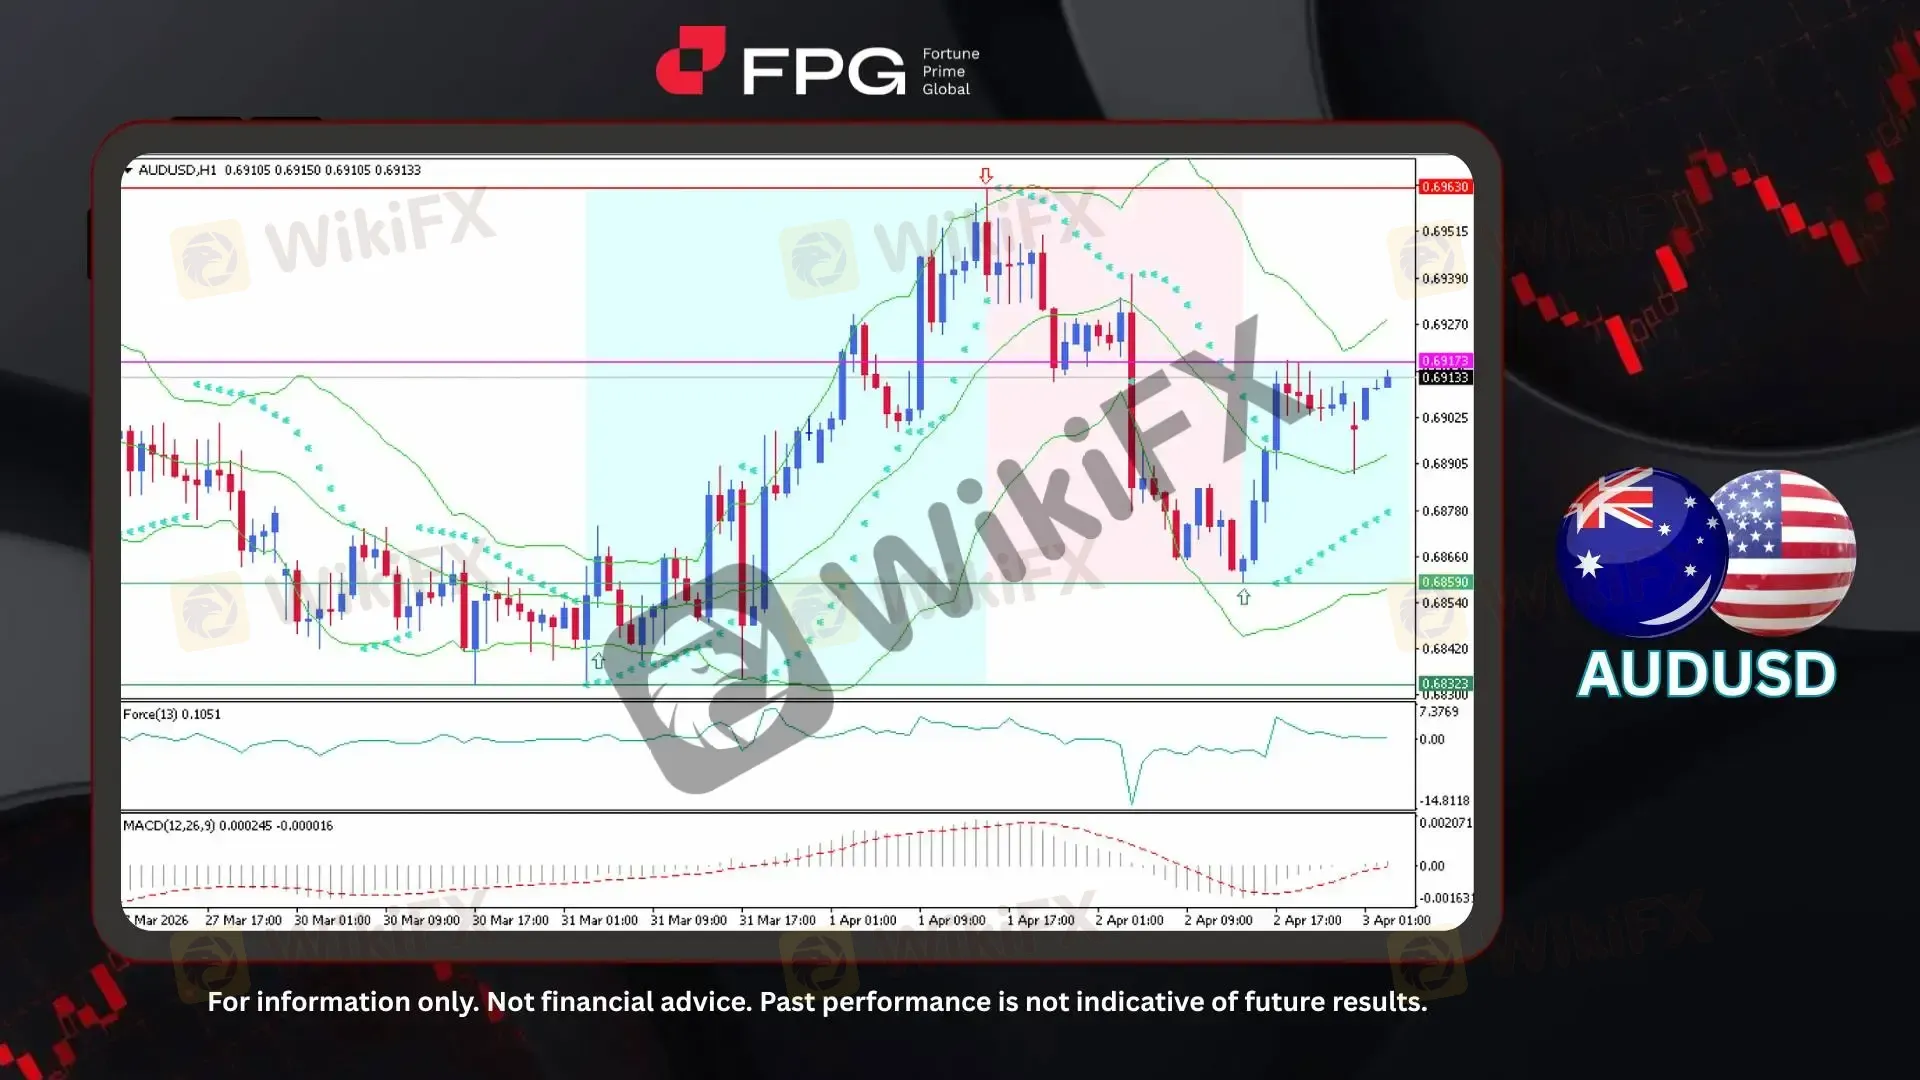
On the H1 timeframe chart, AUDUSD exhibited a strong bullish rally toward the end of last month, advancing from 0.6832 to a peak at 0.6963. Following this high, a clear price rejection emerged, triggering a sharp decline toward 0.6859. However, buying momentum re-entered the market from this level, initiating a trend reversal and pushing the price back into a bullish structure. Currently, AUDUSD is trading around 0.6913, approaching a key resistance level at 0.6917, where short-term price reactions are likely to determine the next directional move.
From a technical indicator perspective, Bollinger Bands show that price is stabilizing near the mid-to-upper band after rebounding from the lower band, indicating a recovery in bullish momentum. The Parabolic SAR has shifted below the price, supporting the current upward bias. Meanwhile, the MACD histogram is gradually recovering from negative territory, suggesting weakening bearish momentum and a potential bullish crossover forming. The Force Index also reflects improving buying pressure, although momentum remains moderate, indicating that confirmation is still needed for a sustained breakout above resistance.
Fundamentally, Australia‘s economic landscape in April 2026 continues to reflect a restrictive monetary policy stance, as the Reserve Bank of Australia maintains elevated interest rates to combat persistent core inflation. The labour market remains relatively tight, with low unemployment and strong job vacancies supporting wage growth, despite early indications of slowing demand. Additionally, external risks such as elevated energy prices and ongoing geopolitical tensions are contributing to concerns over imported inflation and potential stagflation. The domestic housing sector also remains under pressure due to high borrowing costs, which has a notable correlation with AUDUSD movements, reinforcing the pair’s current dynamic and sensitive market conditions.
Technical Market Overview
1. Current Position: AUDUSD is trading around 0.6913, maintaining a short-term bullish recovery after rebounding from the 0.6859 level. Price action is currently approaching a key resistance area, indicating a potential decision zone for the next move.
2. Resistance Zone: The nearest resistance is located at 0.6917. A stronger resistance level is seen at 0.6963, which represents the recent swing high and a key rejection zone.
3. Support Zone: Immediate support is positioned at 0.6859, aligning with the recent reversal base. A deeper support level is found at 0.6832, marking the origin of the previous bullish rally.
4. Indicator Observation: Bollinger Bands indicate price is moving toward the upper band, suggesting increasing bullish momentum. The Parabolic SAR has flipped below the price, supporting an upward bias. MACD shows early signs of bullish recovery, with the histogram rising toward the zero line. The Force Index reflects improving buying pressure, although momentum remains moderate.
5. Technical Summary: AUDUSD is currently in a recovery phase within a broader bullish structure, testing a key resistance zone. A confirmed breakout above this level may open the path for further upside, while rejection could trigger a short-term pullback toward nearby support. Overall, the technical outlook leans cautiously bullish, pending confirmation from momentum indicators.
Market Performance:
Forex Last Price % Change
EUR/USD 1.1542 +0.03%
USD/JPY 159.48 −0.07%
Today's Key Economic Calendar:
CN: RD Services PMI
US: Average Hourly Earnings MoM & YoY
US: Non Farm Payrolls
US: Participation Rate
US: Unemployment Rate
Risk Disclaimer: This report is for informational purposes only and does not constitute financial advice. Investments involve risks, and past performance does not guarantee future results. Consult your financial advisor for personalized investment strategies.
Disclaimer:
Le opinioni di questo articolo rappresentano solo le opinioni personali dell’autore e non costituiscono consulenza in materia di investimenti per questa piattaforma. La piattaforma non garantisce l’accuratezza, la completezza e la tempestività delle informazioni relative all’articolo, né è responsabile delle perdite causate dall’uso o dall’affidamento delle informazioni relative all’articolo.
WikiFX Trader
Rate Calc
USD

CNY
Tasso di cambio attuale:0
inserisci l'importo
USD
A disposizione
CNY
Calcolare 